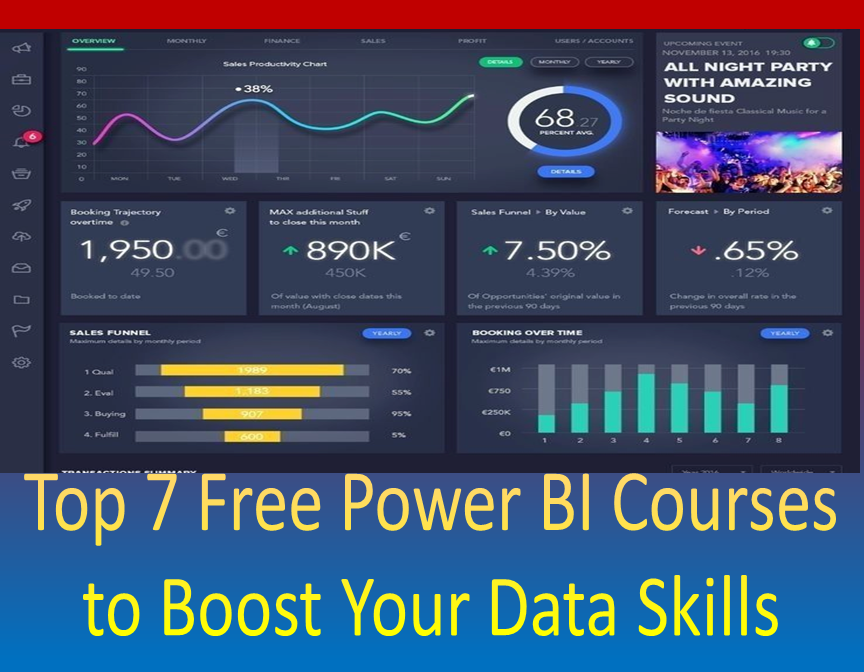
Top 7 Free Power BI Courses to Boost Your Data Skills
Power BI is a powerful business analytics service offered by Microsoft that allows users to easily connect to various data sources, transform and clean data, and create interactive visualizations and reports. If you’re looking to enhance your data analysis and visualization skills, here are 7 free Power BI courses to get you started:
1. From Excel to Power BI
Our program is designed to establish a solid foundation in Power BI, covering essential knowledge and skills such as: importing data from Excel and various sources into Power BI; comprehending the Power BI environment and its three distinct Views; developing beginner to intermediate skills for navigating the Power BI interface; analyzing significant relationships within datasets; creating Power BI visuals and reports; and constructing effective dashboards for sharing, presenting, and collaborating with colleagues in Power BI Service. We invite you to embark on this journey with us.
Click here
2. Data Analysis and Visualization with Power BI
●Recognize the different types of visualizations in Power BI
● Add visualizations to reports and dashboards
● Apply formatting choices to visuals
● Add useful navigation techniques to the Power BI report ● Design accessible reports and dashboards
● Use visualizations to perform data analysis
Click here
3. Data-Driven Decisions with Power BI
Participants will examine the Power BI interface, gaining insights into page management and the fundamental principles of visualizations. They will have the opportunity to download a course dataset and participate in various practical activities to learn how to import, connect, clean, transform, and model their own data within the Power BI desktop application. Additionally, participants will explore reports, familiarize themselves with workspaces, and practice the processes of viewing, creating, and publishing reports to the Power BI service. Ultimately, they will achieve proficiency in the development and use of dashboards.
Click here
4.Data Modeling in Power BI
- Learn new concepts from industry experts
- Gain a foundational understanding of a subject or tool
- Develop job-relevant skills with hands-on projects
- Earn a shareable career certificate from Microsoft
Click here
5.Extract, Transform and Load Data in Power BI
• Identify, explain and configure multiple data sources in Power BI
• Clean and transform data using Power Query
• Inspect and analyze ingested data to ensure data integrity
Click here
6.Creative Designing in Power BI
● Create compelling and cohesive reports and dashboards
● Recognize common problems in design in Power BI Reports and Dashboards
● Produce audience focused reports and dashboards
● Work in detail with specialist chart visualizations ● Use visualizations in reports
● Add elements such as videos, streaming data and QR codes to dashboards
Click here
7.Business Analytics Specialization
The courses in this Specialization will focus on strategy, methods, tools, and applications that are widely used in business. Topics covered include:
- Data strategy at firms
- Reliable ways to collect, analyze, and visualize data–and utilize data in organizational decision making
- Understanding data modeling and predictive analytics at a high-level
- Learning basic methods of business analytics by working with data sets and tools such as Power BI, Alteryx, and RStudio
- Learning to make informed business decisions via analytics across key functional areas in business such as finance, marketing, retail & supply chain management, and social media to enhance profitability and competitiveness.
